Use logs to see what happened during a deployment or application request. Bex exposes service logs in the dashboard and through an authenticated API. Available history and log types depend on the instance's collection and storage configuration; an absent log source is not evidence that no errors occurred.
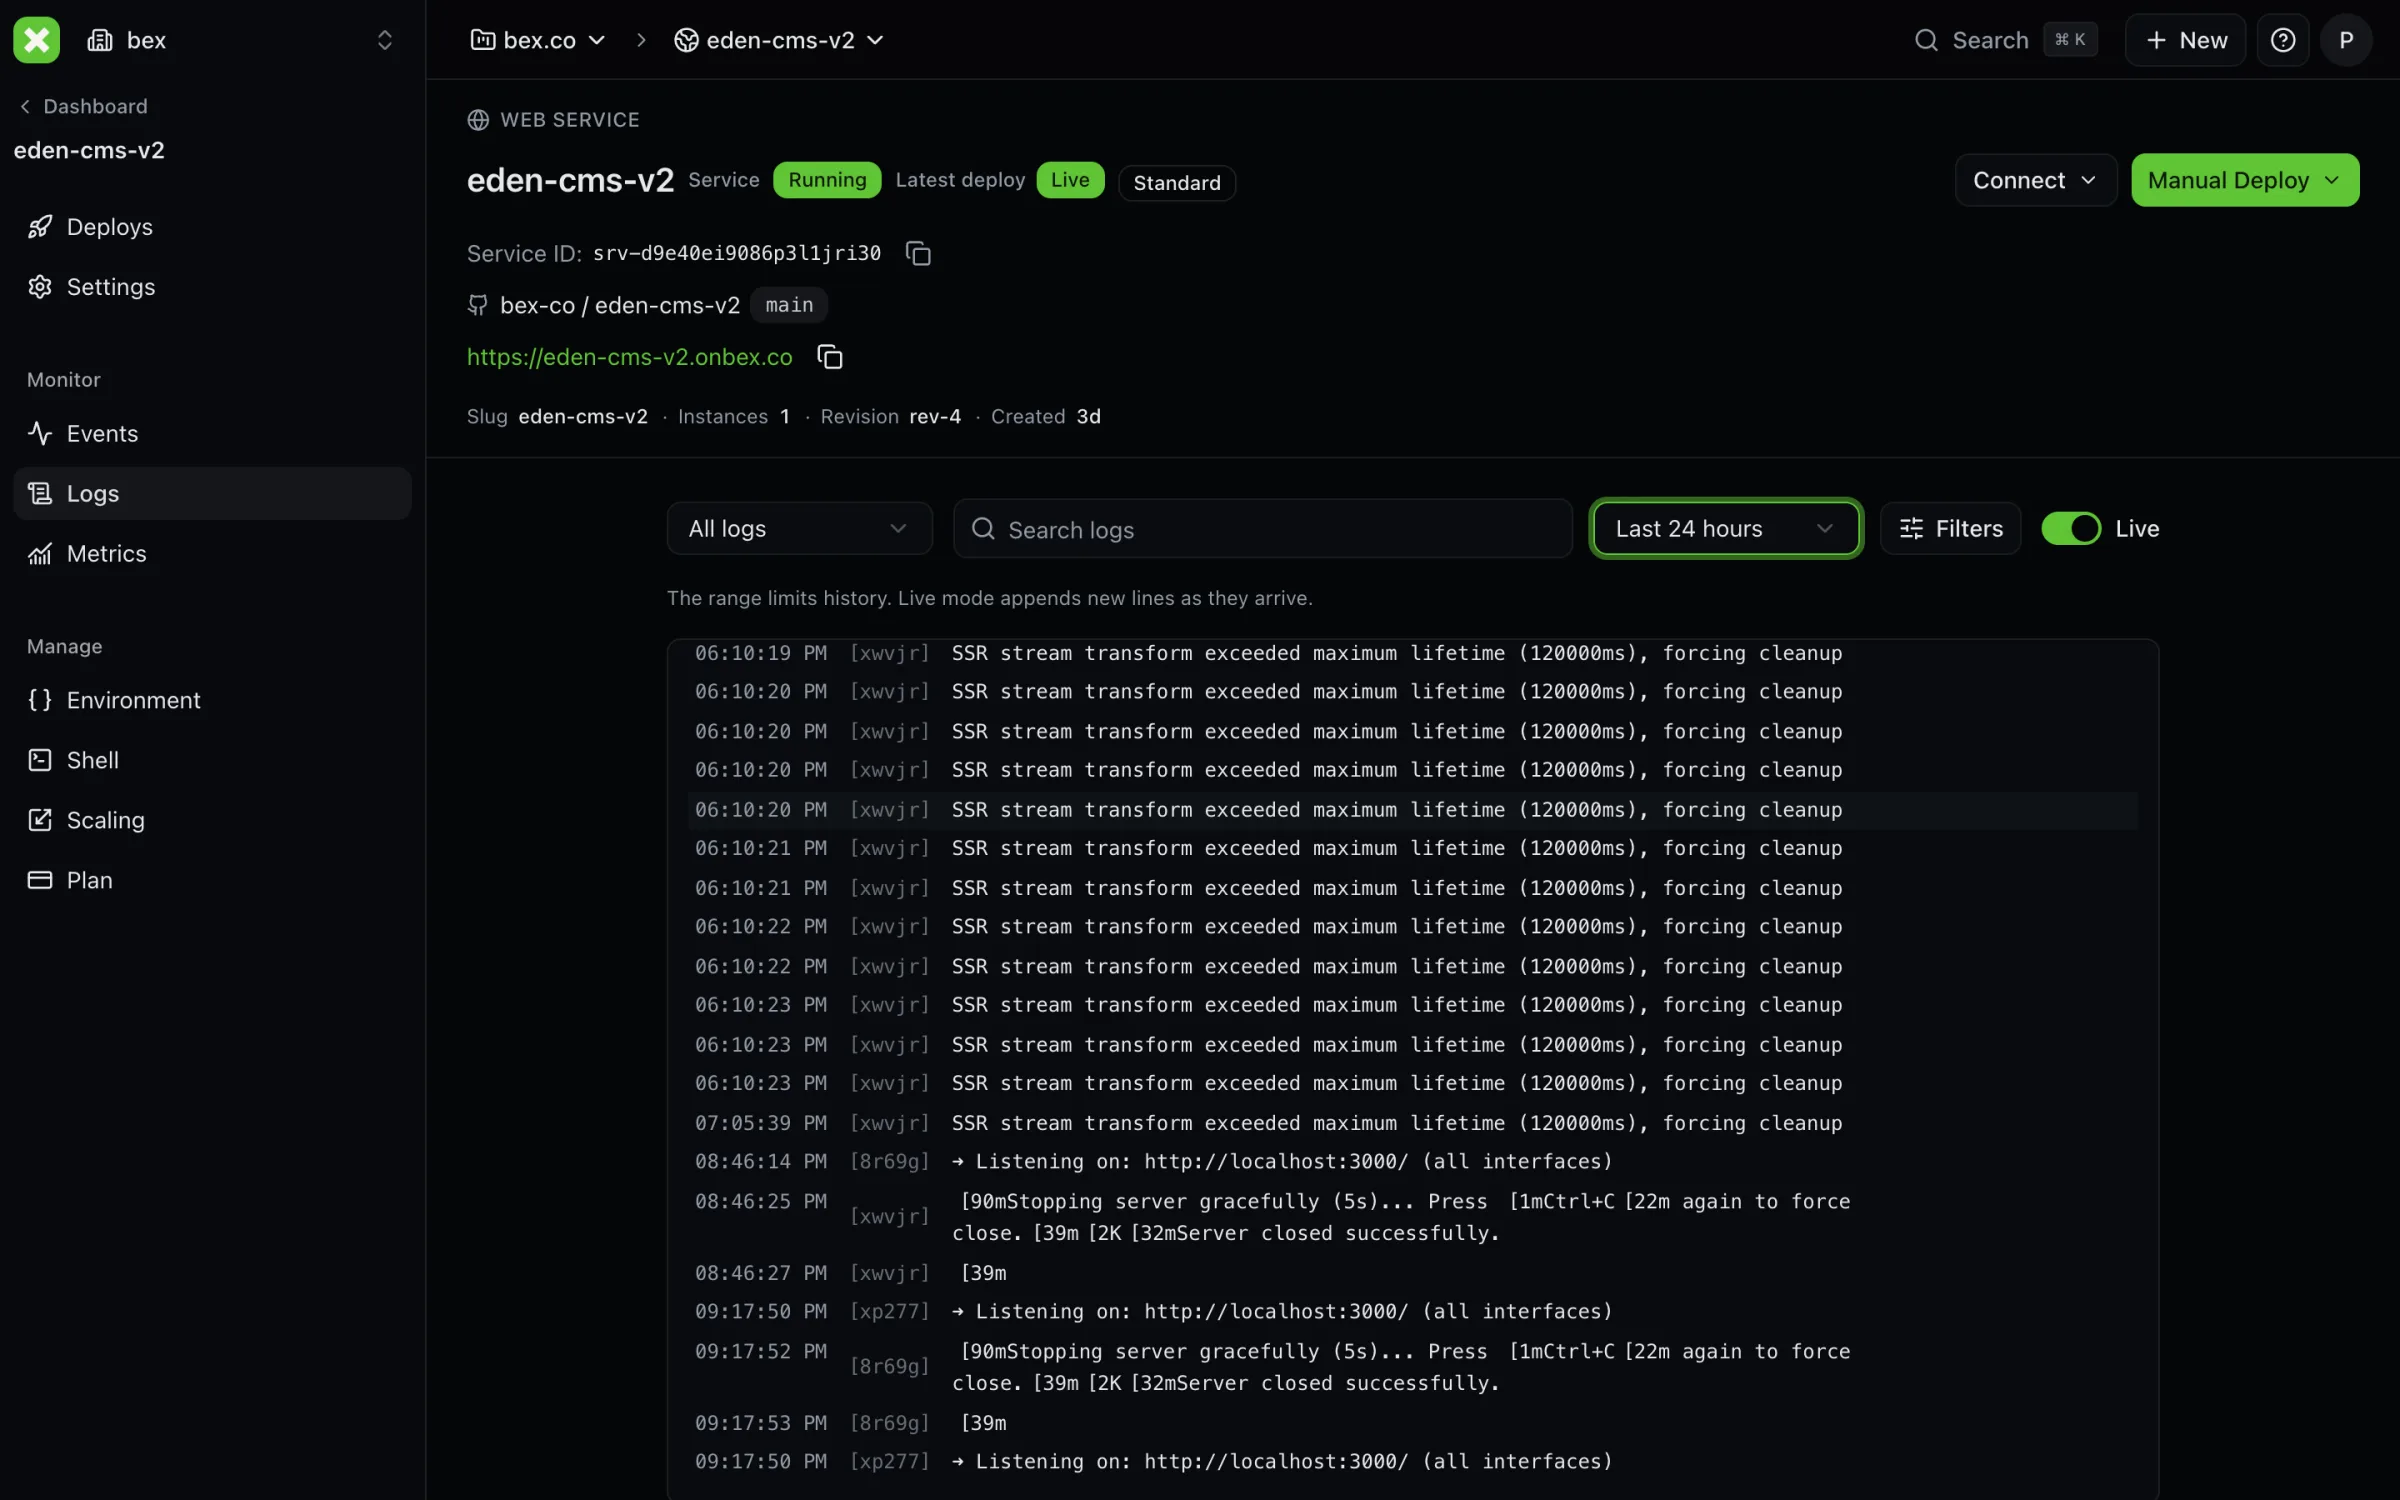
Select the right output
| Log type | Use it to investigate |
|---|---|
Application (app) | Process output, startup failures, worker activity, and application errors. |
Request (request) | HTTP traffic observed by the configured request-log pipeline. |
Build (build) | Source checkout, dependency installation, compilation, and image creation. |
Pre-deploy (predeploy) | The pre-deploy command's output. |
Send application logs to stdout/stderr. Files written inside the container are not automatically equivalent to collected process output. Do not print tokens, passwords, connection strings, or sensitive request bodies into logs.
Workers and cron jobs do not expose public HTTP endpoints. Static sites have no per-site application server process. Select output appropriate to the workload instead of expecting all four sources for every service.
Query a service
Set BEX_API_URL, an authorized BEX_TOKEN, and SERVICE_ID:
curl --fail-with-body --get "$BEX_API_URL/v1/logs" \
  -H "Authorization: Bearer $BEX_TOKEN" \
  --data-urlencode "resource=$SERVICE_ID" \
  --data-urlencode "type=app" \
  --data-urlencode "limit=100"
Narrow the query using text, level, instance, startTime, or endTime.
Request-log filters additionally include host, statusCode, method, and
path. Use RFC 3339 timestamps with an explicit timezone for time bounds.
Build and pre-deploy types must each be requested on their own, not combined
with other types.
Responses include log entries and pagination information such as hasMore and
next time boundaries. A page capped at 100 entries is not the full history.
Use the returned boundaries for the next query, and retain a narrow incident
window rather than repeatedly requesting all retained data.
Watch live output
The dashboard supports live tail. For an SSE client:
curl --no-buffer --fail-with-body --get "$BEX_API_URL/v1/logs/subscribe" \
  -H "Authorization: Bearer $BEX_TOKEN" \
  -H "Accept: text/event-stream" \
  --data-urlencode "resource=$SERVICE_ID" \
  --data-urlencode "type=app"
Stop the local client with Ctrl-C when finished. Live subscriptions also support other transport forms for compatible clients; SSE is sufficient for this example. Reconnect deliberately after transport failures, and query historical logs for any interval you need to recover.
Investigate an incident
Start with the affected service and deployment time. Check build/pre-deploy output if the new version never started; check application output and health checks if it started but did not become ready. For a traffic incident, narrow request logs to the method, path, or status and correlate with application output from the same interval.
Retention, query-window limits, and backend availability belong to the Bex instance's configuration. A 503 can indicate a missing/unavailable source; an empty successful response can mean the selected window or filters matched nothing. Remove filters progressively and inspect ingestion before treating an empty result as a clean bill of health.
See Metrics for trends and Notifications for event-driven alerts. For a bounded local dump of one service window, use the incident report collector.